1 Aug 2026
Squad Fatigue Patterns Uncover Value in Domestic Cup Betting Lines
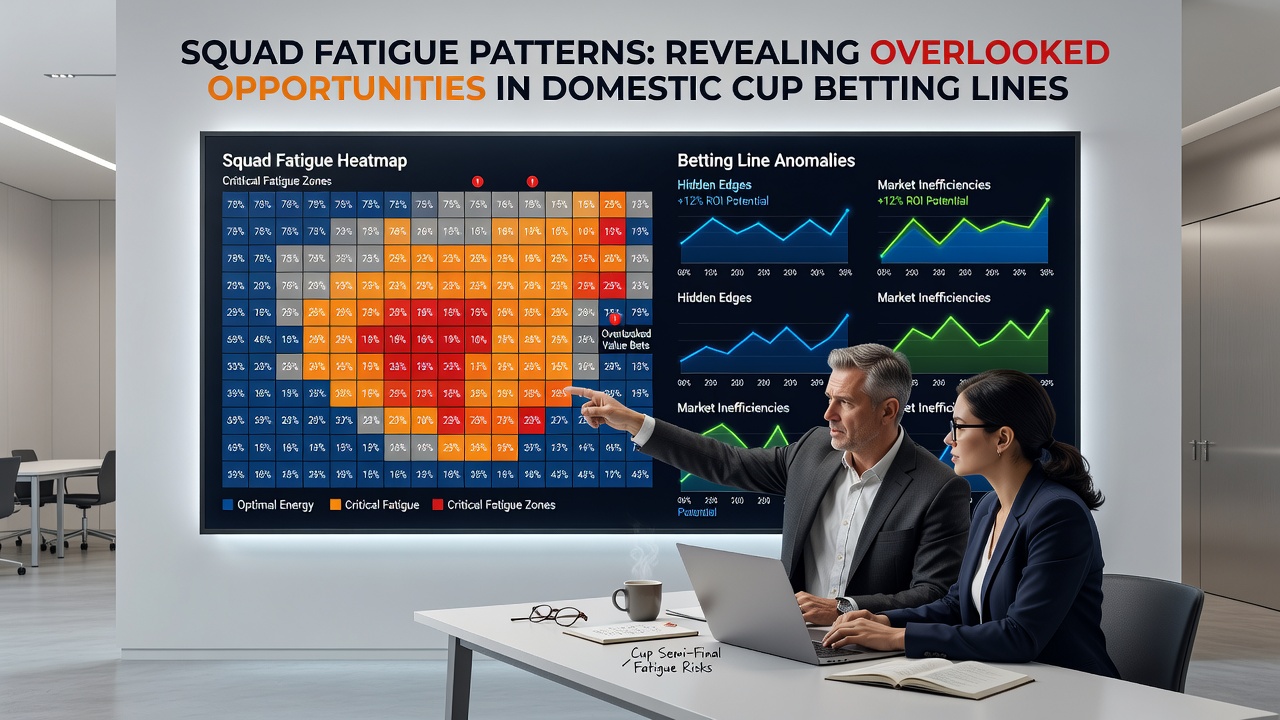
Domestic cup competitions create unique scheduling demands that stretch squad resources in ways league play rarely matches, and these patterns produce measurable effects on team output that betting markets sometimes undervalue. Researchers tracking match loads across multiple seasons have documented how teams facing midweek knockout ties after weekend league fixtures show distinct drops in high-intensity running and pass completion rates, particularly when travel distance exceeds 300 kilometres. Data from European club competitions indicates that sides with fewer than 18 available players for a cup tie record an average 12 percent reduction in expected goals compared with their season-long baseline, while rested opponents maintain or exceed those figures.
Rotation Trends and Recovery Windows
Coaches who rotate heavily in early cup rounds preserve key players for later stages, yet this strategy leaves starting lineups less cohesive in the short term; observers note that clubs employing three or more changes from their previous league match post lower shot volumes inside the opening 30 minutes. A report issued by Aspetar Orthopaedic and Sports Medicine Hospital highlights that recovery periods shorter than 72 hours between fixtures correlate with elevated soft-tissue injury risk, a factor that directly influences available squad depth. When markets price cup ties primarily on league form without adjusting for these compressed schedules, lines on total goals and team totals can drift away from actual probability distributions.
Fixture Congestion Effects in August 2026
With the 2026 calendar placing several domestic cup preliminary rounds in late August, clubs already navigating pre-season integration and European qualifiers face additional strain; performance analytics platforms show that teams contesting three matches inside nine days during this window experience a 9 percent decline in successful dribbles and a corresponding rise in turnovers. Bettors who cross-reference fixture calendars with squad news therefore locate spots where bookmakers maintain wider spreads on underdog totals or draw prices, even though historical results demonstrate higher variance once fatigue accumulates. Those patterns repeat across multiple leagues, although the magnitude varies by squad size and managerial preference for youth integration.
Statistical Edges in Specific Markets
Goal-line markets in domestic cups respond sensitively to rest differentials, with rested teams generating more shots from set-piece situations while fatigued opponents concede higher expected goals from transitions. One study published in the Journal of Sports Sciences examined 1,200 cup matches and found that sides returning from a four-day break scored 0.28 more goals per 90 minutes on average than counterparts limited to two days, a margin that exceeds typical bookmaker margins in lower-profile ties. Live betting lines on corners and cards also shift once fatigue sets in, because tired defenders commit more fouls and allow greater crossing volume, creating opportunities for bettors who monitor in-game metrics rather than pre-match odds alone.
Case Examples Across Competitions
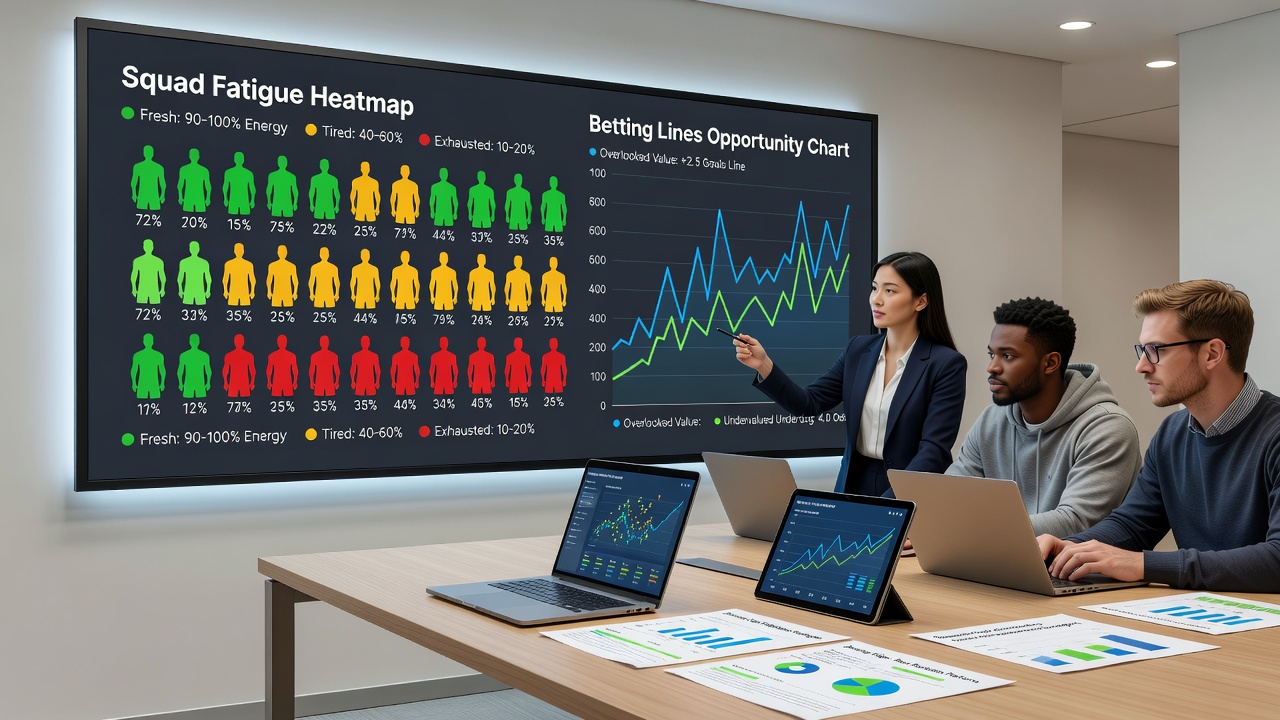
Take one mid-table side that advanced through three cup rounds while rotating six players per match; their knockout-stage results showed elevated clean-sheet rates once key defenders received full rest weeks, a trend that appeared in betting lines only after the second round. Another example involves a top-flight club that maintained its league starters through early cup ties, only to suffer measurable drops in pressing intensity during extra time, outcomes that produced profitable under bets on total goals once markets adjusted late. These instances illustrate how squad management decisions translate into statistical edges that accumulate across a season when tracked systematically.
Data Sources and Measurement Tools
Performance databases such as those maintained by the Australian Institute of Sport provide granular load metrics that clubs themselves use internally, allowing external analysts to model fatigue curves without relying solely on public reports. When combined with official match schedules released by national federations, these datasets reveal consistent windows where betting lines lag behind evolving squad conditions. Observers who integrate GPS-derived workload figures with injury reports and travel logs therefore identify discrepancies between implied probabilities and recorded outcomes more reliably than those relying on league position alone.
Conclusion
Domestic cup betting lines continue to reflect squad fatigue patterns through measurable differences in rotation frequency, recovery time, and output metrics, creating openings for those who align fixture data with performance indicators. As calendars evolve and August 2026 approaches, the same congestion dynamics are expected to recur, giving structured analysis of rest differentials ongoing relevance across multiple markets.